
High Sensitivity & Specificity
(Click to enlarge)
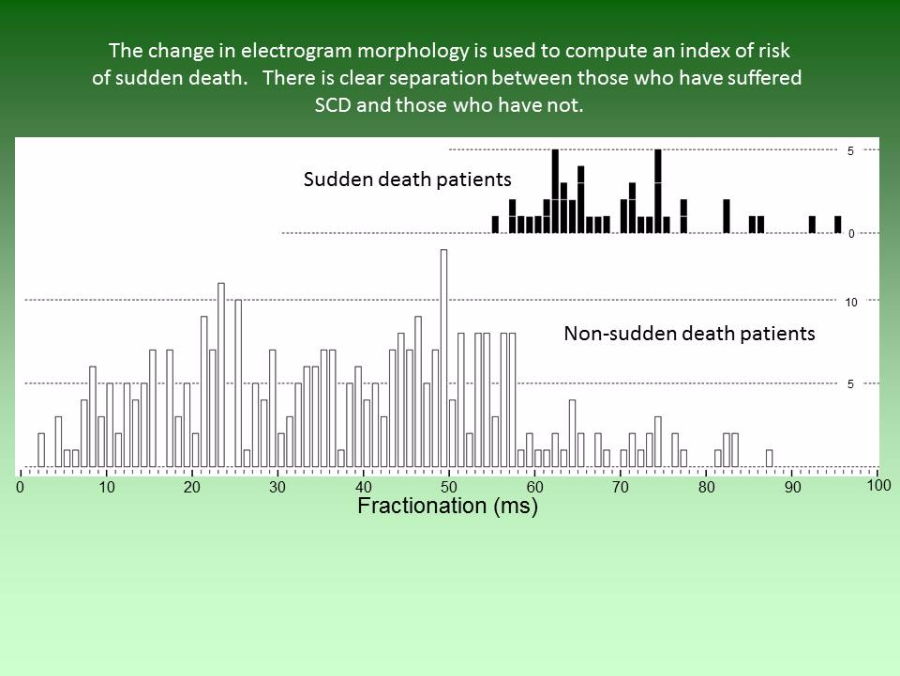
All the curves obtained from one patient are analysed and they are reduced to "fractionation index" that incorporates the increase in duration and the S1S2 interval at which delay increases. One group of VF patients (black) and non-VF patients are shown above.
These distributions show a high degree of distinction between patients at risk of sudden death (>55) and those at low risk (<50) so allowing patients to be put into high-risk and low-risk groups on the basis of PEFA