
Electrogram Analysis
Timing of Electrograms

(Click to enlarge)
The only significant feature used is the delay of each peak in the electrogram (which may be very small) following the pacing stimulus. These are identified using multiple signal processing techniques so that each electrogram is represented by a set of delays.
Formation of curves
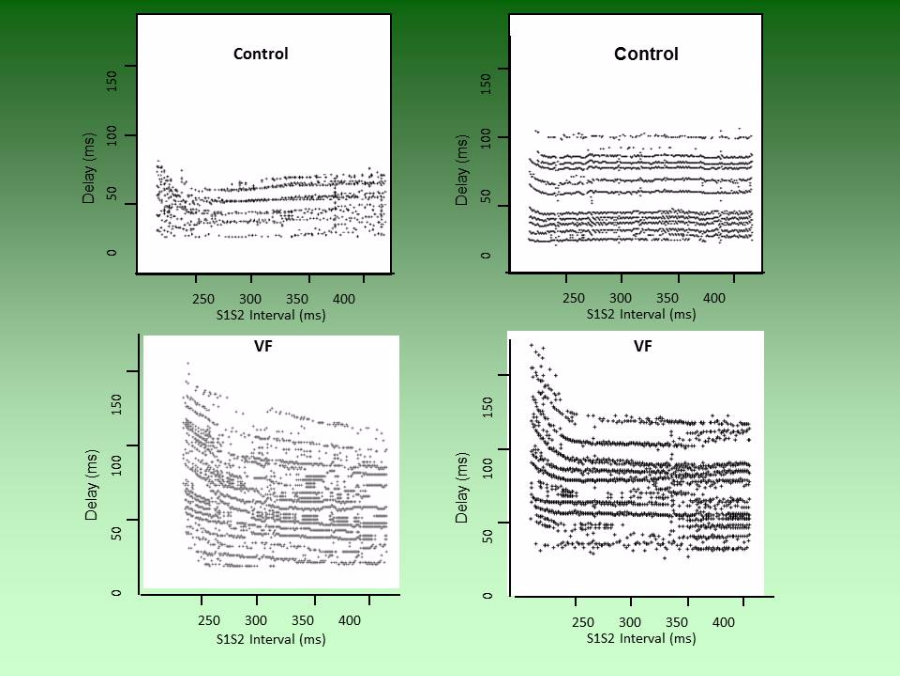
The delay of features in the electrogram is plotted at the S1S2 interval at which it was obtained. These form curves that describe the conduction between the stimulating and recording electrodes for all S1S2 intervals. The top curves (below) are from patients with normal hearts and show very little change with the S1S2 interval.
The lower curves are taken from VF patients and show an increasing delay when the S1S2 interval is decreased. This pattern is very characteristic, although there are subtle differences between diseases. The curves characterise abnormal conduction.